1. In mid to late successional plant communities, any woody plant less than 6-meters tall is considered a shrub.
2. In mid to late successional plant communities, any woody plant greater than 6-meters tall is considered a tree.
3. However, if the data being collected are on newly planted or early succession natural areas targeted to eventually become late successional plant communities, at least in the earlier developmental stages, trees and shrubs will have to be differentiated for layer assignments by their potential heights rather than by their actual heights. Once assigned to their appropriate layer, then the actual modified Kuchler height classes (Table 2) should be entered for each species in their respective Tree and Shrub Index text boxes.
4. For each species, enter the Daubenmire percent cover mid-points (Table 1) in the percent cover text boxes. Because vegetation can overlap other vegetation, the total percent cover in any given Vegetation Index (Tree, Shrub, or Herb) can exceed 100-percent.
5. For each species, enter the number of tree stems in the sample plot tree layer 'number stems' text box and the number of shrub stems in the sample plot shrub layer 'number stems' text box.
6. For each species, enter the modified Kuchler height class numbers (Table 2) in the Tree, Shrub, Herbaceous, and Substrate Index text boxes. Note: If the same species is found in a sample plot with one or more different height classes, it should be entered once for each of the height classes documented. Likewise, the percent cover of each respective height class should be evaluated seperately and entered accordingly.
7. Except under the Substrate Index layer, for each species, enter the Reed Moisture Index numbers (Table 3) in the Moisture Index text boxes. The average Moisture Index of all the layers will automatically populate the Moisture Index text box in the Substrate Index layer.
8. Except under the Substrate Index layer, for each species, enter the Marshall Weed Index numbers (Table 4) in the Weed Index text boxes. The average Weed Index of all the layers will automatically populate the Weed Index text box in the Substrate Index layer.
9. Except under the Substrate Index layer, for each species, enter the Hutchinson Salinity Index numbers (Table 5) in the Salinity Index text boxes. The average Salinity Index of all the layers will automatically populate the Salinity Index text box in the Substrate Index layer.
10. Always select all of the buttons in each Vegetation and Substrate Index (Tree, Shrub, Herb, and Substrate) layers, even if there are no data entered in a given Vegetation Index layer.
11. The genus and species data entries are self explanatory in the Vegetation Index (Tree, Shrub, Herb) layers. In the Substrate Index layer the first text box takes the soil series name and the second text box takes the soil surface texture (e.g., clay, silt, sand, gravel, cobble, rock) if mineral or decomposition state (e.g., litter, duff, peat, muck) if organic.
12. Select the next five buttons: 'Substrate Structure Index', 'Substrate Moisture Index', 'Substrate Salinity Index', and 'Structure Indexes' to calculate those metrics.
13. Select the next four buttons: 'Predictive Vegetation Structural Indexes', 'Vegetation Moisture Index', 'Vegetation Weed Index', and 'Vegetation Salinity Index' to view graphical representations of the calculated metrics.
14. Select the next two buttons (Vegetation Salt Tolerance and Vegetation Dominant Class) to view those vegetation performance outcomes based on the sample data.
15. Enter the weed tolerance index threshold you wish to use to evaluate if the sample is adequately represented by native plant species (the recommended convention is 1.5). The operation used by the software method logic is <= the number you enter. Then select the 'Nativity Vegetation Met' button to verify whether the threshold you entered has been met.
16. Enter the tree sample plot size in square feet (e.g., a 15-foot radius circlular plot is about 706 square feet).
17. Enter the shrub sample plot size in square feet (e.g., a 5-foot radius circlular plot is about 78 square feet).
18. For forested target management units, enter the minimum tree stem density (>=) you wish to use to evaluate if the sample is currently a forest or on a successful trend toward becoming a forest. The generally accepted convention is to either use reference site data or to use a stem density threshold set by the regulatory authorities with oversight. Next, select the 'Calculate Tree Stems/Acre' button to verify if the minimum stem density threshold you entered has been met.
19. For shrub target management units, enter the minimum shrub stem density (>=) you wish to use to evaluate if the sample is currently a shrub dominated plant community or on a successful trend toward becoming a shrub dominated plant community. The generally accepted convention is to either use reference site data or to use a stem density threshold set by the regulatory authorities with oversight. Next, select the 'Calculate Tree Stems/Acre' button to verify if the minimum stem density threshold you entered has been met.
20. For herbaceous target management units, enter the maximum tree stem density (<) you wish to use to evaluate if the sample is currently an open meadow, prairie or emergent wetland or on a successful trend toward becoming an open meadow, prairie or emergent wetland. The generally accepted convention is to either use reference site data or to use a stem density threshold set by the regulatory authorities with oversight. Next, select the 'Calculate Tree Stems/Acre' button to verify if the maximum stem density threshold you entered has been maintained or exceeded.
21. For herbaceous target management units, enter the maximum shrub stem density (<) you wish to use to evaluate if the sample is currently an open meadow, prairie or emergent wetland or on a successful trend toward becoming an open meadow, prairie or emergent wetland. The generally accepted convention is to either use reference site data or to use a stem density threshold set by the regulatory authorities with oversight. Next, select the 'Calculate Shrub Stems/Acre' button to verify if the maximum stem density threshold you entered has been maintained or exceeded.
22. For wetland target management units, enter the maximum moisture index tolerance threshold (<=) you wish to use to evaluate if the sample is adequately represented by plant species tolerant of wetland hydrology ranges. The generally accepted convention is <= 3.0). Then select the 'Wetland Vegetation' button to verify whether the threshold you entered has been met. Note: Vegetation, soils, and hydrology observations are collectively necessary to make wetland determinations.
23. For upland target management units, enter the minimum moisture index tolerance threshold (>) you wish to use to evaluate if the sample is adequately represented by plant species intolerant of wetland hydrology ranges. The generally accepted convention is > 3.0). Then select the 'Upland Vegetation' button to verify whether the threshold you entered has been met.
24. Be sure to enter the Site Name, Site Visit Date, Management Unit, Transect, Sample Number, Latitude, Longitude, and 5th-Field Hydrologic Unit Code (HUC) for each of your sample plots in the appropriate text boxes.
25. Keep in mind, this version of the software application is only providing data entry and calculated metrics oppotunities for a single sample plot. Future versions are planned for allowing data entry and calculated metrics for multiple sample plots, transects, management units, and sites.
NOTE: If at any time you leave or close the current version of the Vegetation Index Calculator web page (such as hyperlinking to these instructions), if you come back to it the page will be refreshed in its original state without any of the data entries or calculated metrics displayed. At this time, the only way to keep a permanent record of your data entries and calculated metrics is to collect a full screen shot of the web page and store it as an image file (see inserted image below) before you close or leave it. However, work is in progress toward connecting this or a similar web page graphical user interface (GUI) to a relational database for permanent data archival, advanced query, and reporting capabilities.
Table 1. Daubenmire Cover Classes - Percent of Sample Plot Covered (Daubenmire 1968).
| Cover Class Number | Percent Cover Class Range | Percent Cover Class Mid-Point |
|---|---|---|
| 1 | 0 - 5.0 | 2.5 |
| 2 | 5.0 - 25.0 | 15.0 |
| 3 | 25.0 - 50.0 | 37.5 |
| 4 | 50.0 - 75.0 | 62.5 |
| 5 | 75.0 - 95.0 | 85.0 |
| 6 | 95.0 - 100.0 | 97.5 |
Table 2. Vegetation Height Classes - (Modified - Kuchler 1966).
| Height Class Number | Height Class Range (meters) |
|---|---|
| 1 | < 0.1 |
| 2 | 0.1 - 0.5 |
| 3 | 0.5 - 2.0 |
| 4 | 2.0 - 6.0 |
| 5 | 6.0 - 10.0 |
| 6 | 10.0 - 20.0 |
| 7 | 20.0 - 35.0 |
| 8 | 35.0 - 45.0 |
| 9 | 45.0 - 55.0 |
| 10 | 55.0 - 65.0 |
| 11 | 65.0 - 75.0 |
| 12 | 75.0 - 85.0 |
| 13 | 85.0 - 95.0 |
| 14 | 95.0 - 105.0 | 15 | > 105.0 |
Source: Analyzing the Physiognomy and Structure of Vegetation
Table 3. Wetland Indicator Status Ratings and their Rating Categories as Described in the National List of Plant Species that Occur in Wetlands (Reed 1988).
| Indicator Status | Abreviation | Percent Occurrence in Wetlands | Moisture Index |
|---|---|---|---|
| Obligate. Occur almost always under natural conditions in wetlands. | OBL | 99 | 1 |
| Facultative Wetland. Usually occur in wetlands but occasionally found in non-wetlands. | FACW | 67 - 99 | 2 |
| Facultative. Equally likely to occur in wetlands and nonwetlands. | FAC | 34 - 66 | 3 |
| Facultative Upland. Usually occur in non-wetlands but occasionally found in wetlands. | FACU | 1 - 33 | 4 |
| Upland. Occur in wetlands in another region but occur almost always under natural conditions in non-wetlands in the region specified. |
UPL | 1 | 5 |
Source: National Wetland Plant List Indicator Rating Definitions
Table 4. Plant Nativity Status Ratings and their Rating Categories (Marshall 2010).
| Nativity Status | Abreviation | Weed Index |
|---|---|---|
| Native. Occurs naturally in region sampled prior to European occupation. | N | 1 |
| Non-native. Not invasive. Introduced into the region sampled during or after arrival of non-indigenous peoples. Does not tend to invade, out compete other species, and dominate in the plant community sampled. |
NN | 3 |
| Non-native Invasive. Invasive. Introduced into the region sampled during or after arrival of non-indigenous peoples. Tends to invade, out compete other species, and dominate in the plant community sampled. |
NNI | 5 |
Table 5. Plant Salinity Tolerance Indicator Status Ratings and their Rating Categories (Hutchinson 1977).
| Indicator Status | Abreviation | Salt Tolerance Range | Salinity Index |
|---|---|---|---|
| Very Sensitive. Occur almost always in non-tidal or fresh water tidal regimes. | VS | 0 - 0.5 ppt | 1 |
| Sensitive. Occur usually in non-tidal or fresh water tidal regimes but also occasionally found in the brackish / freshwater interfaces. |
S | 0.5 - 5.0 ppt | 2 |
| Moderately Sensitive. Occur usually in in the brackish / freshwater interfaces where, depending on river flow cfs and tide stage, area is relatively equally influenced by both fresh and slightly brackish water. |
MS | 5.0 - 10.0 ppt | 3 |
| Moderately Tolerant. Occur usually in in the brackish / freshwater interfaces where, depending on river flow cfs and tide stage, area is relatively more influenced by slightly brackish water than freshwater. |
MT | 10.0 - 15.0 ppt | 4 |
| Tolerant. Occur usually in in the brackish / freshwater interfaces where, depending on river flow cfs and tide stage, area is relatively more influenced by brackish water than freshwater. |
T | 15.0 - 20.0 ppt | 5 |
| Very Tolerant. Occur frequently in in the areas of brackish water influences nearing or exceeding oceanic salinity. |
VT | > 20.0 ppt | 6 |
Source: Salinity Tolerance of Plants of Estuarine Wetlands and Associated Uplands
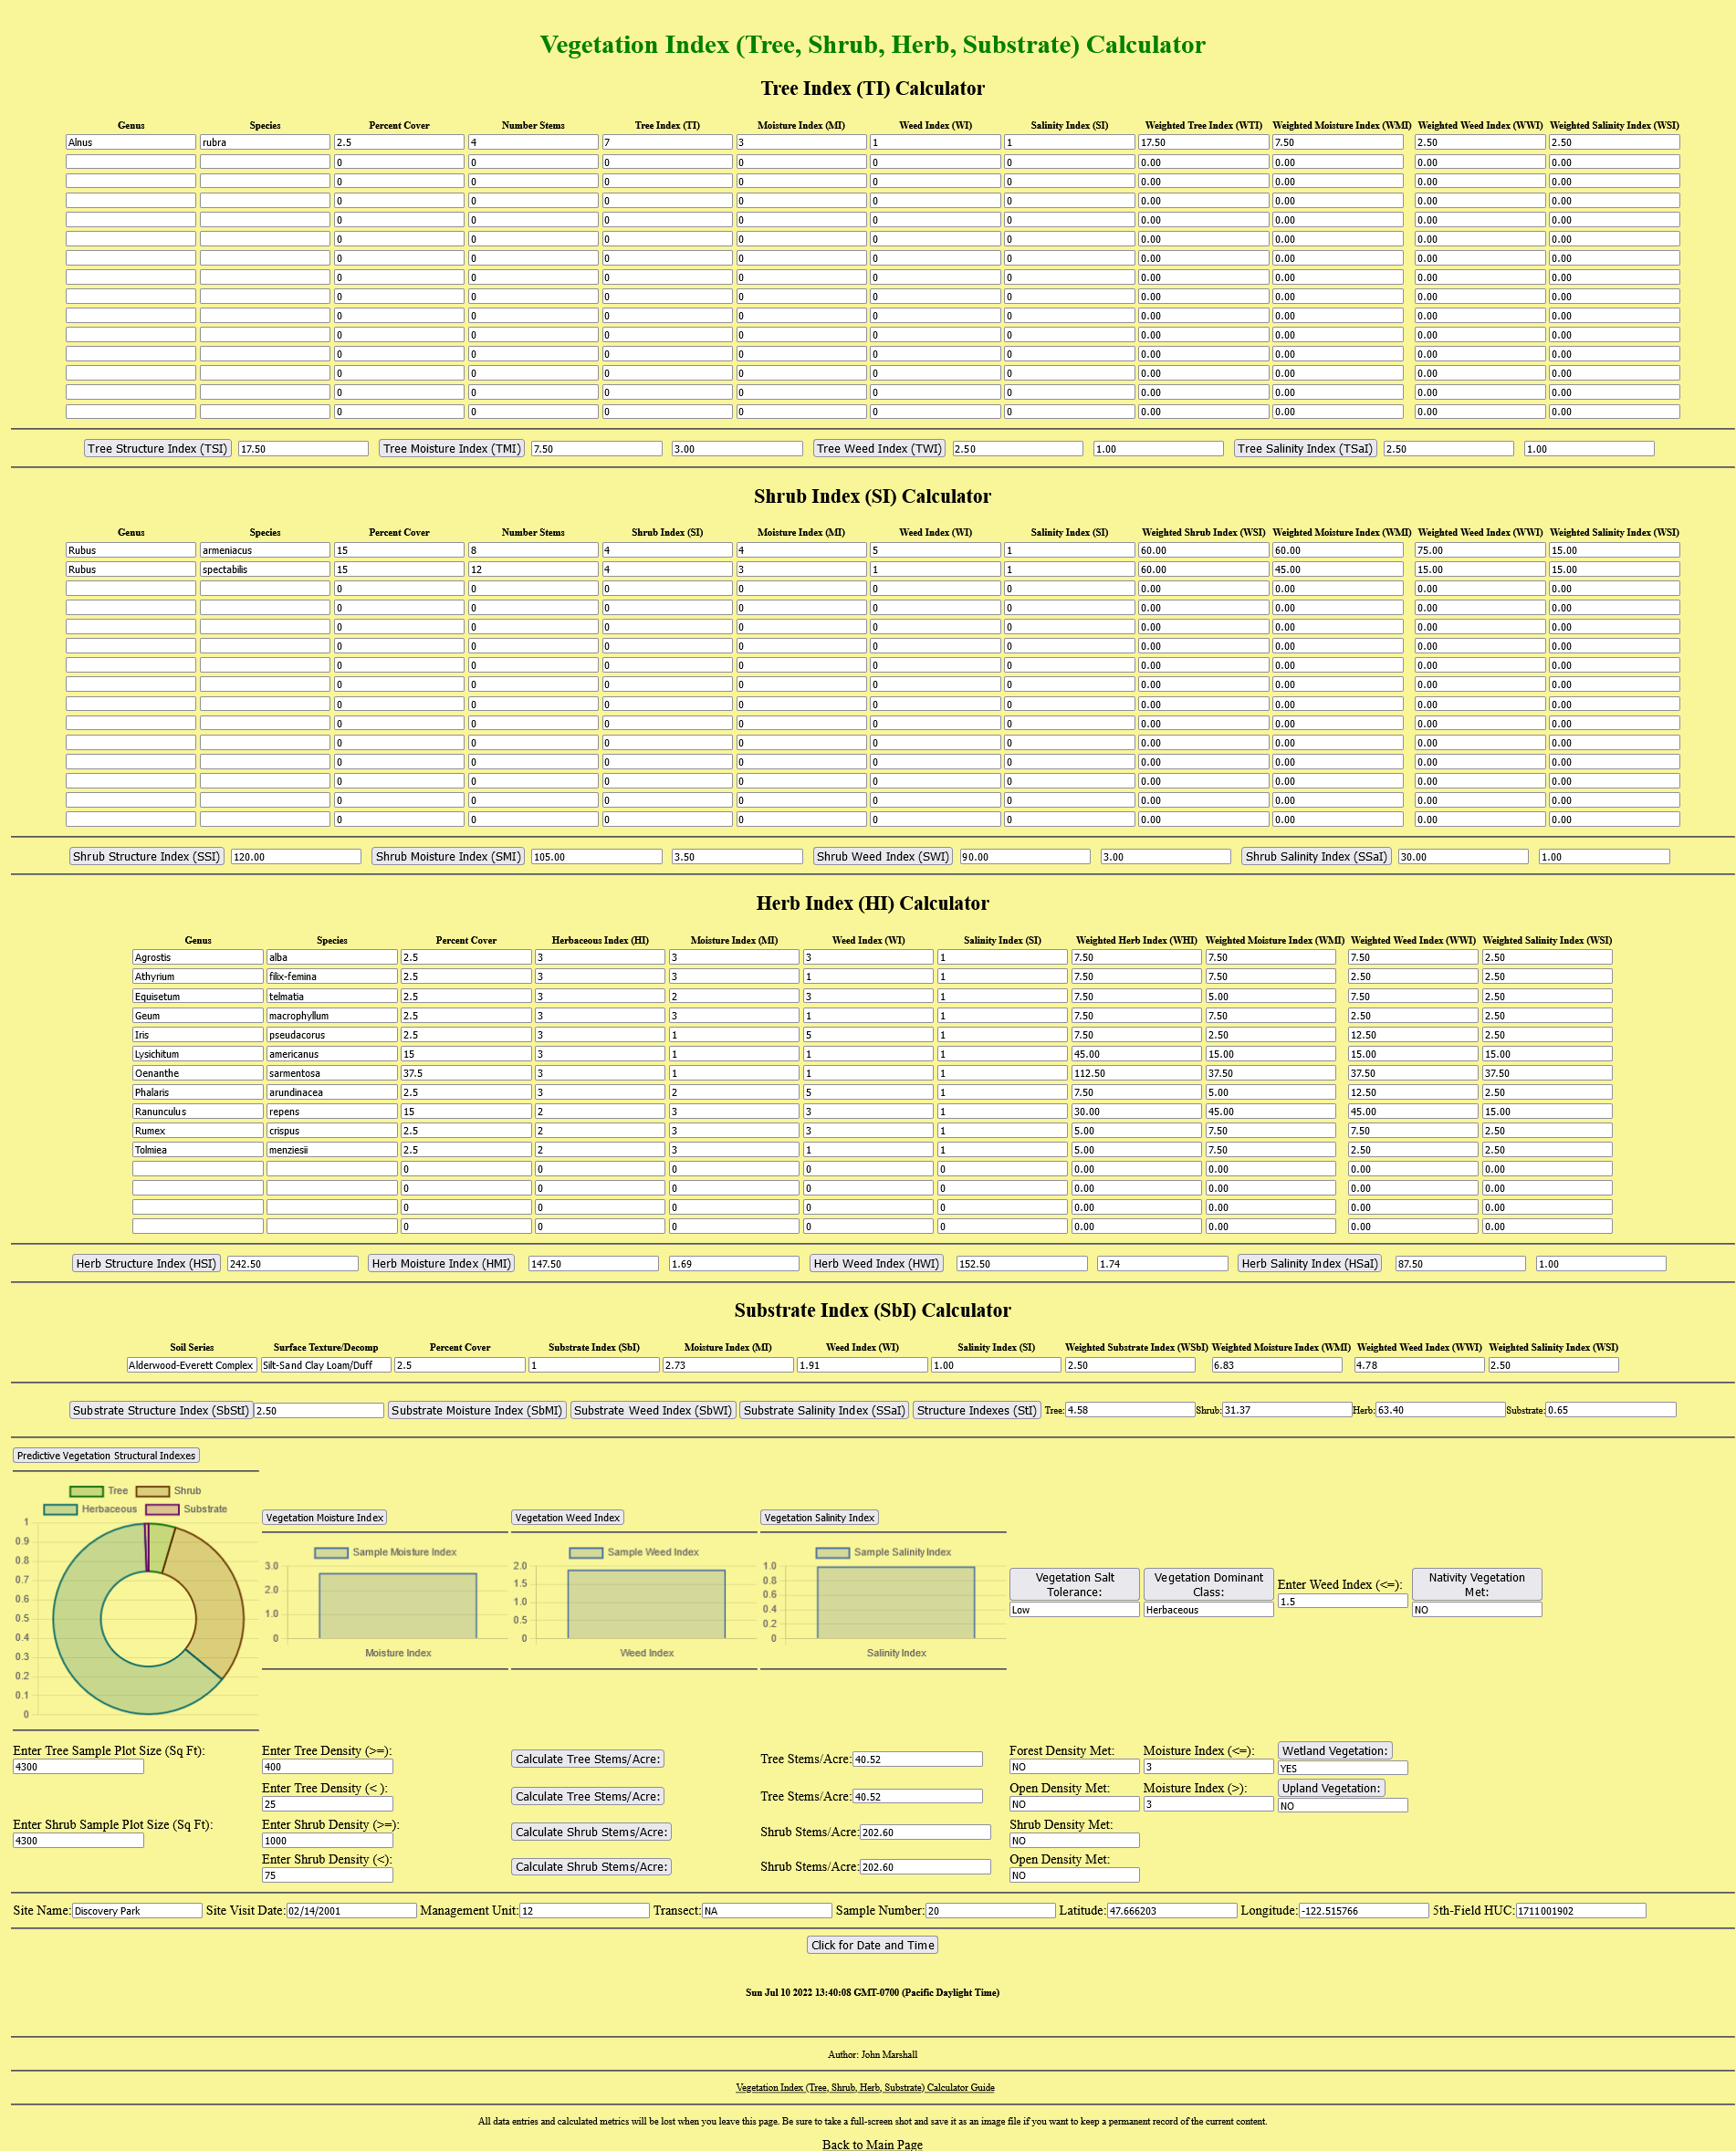
Vegetation (Tree, Shrub, Herb) and Substrate Indexes of Discovery Park Management Unit 12 Sample 20 February 14, 2001 |
|---|
 |
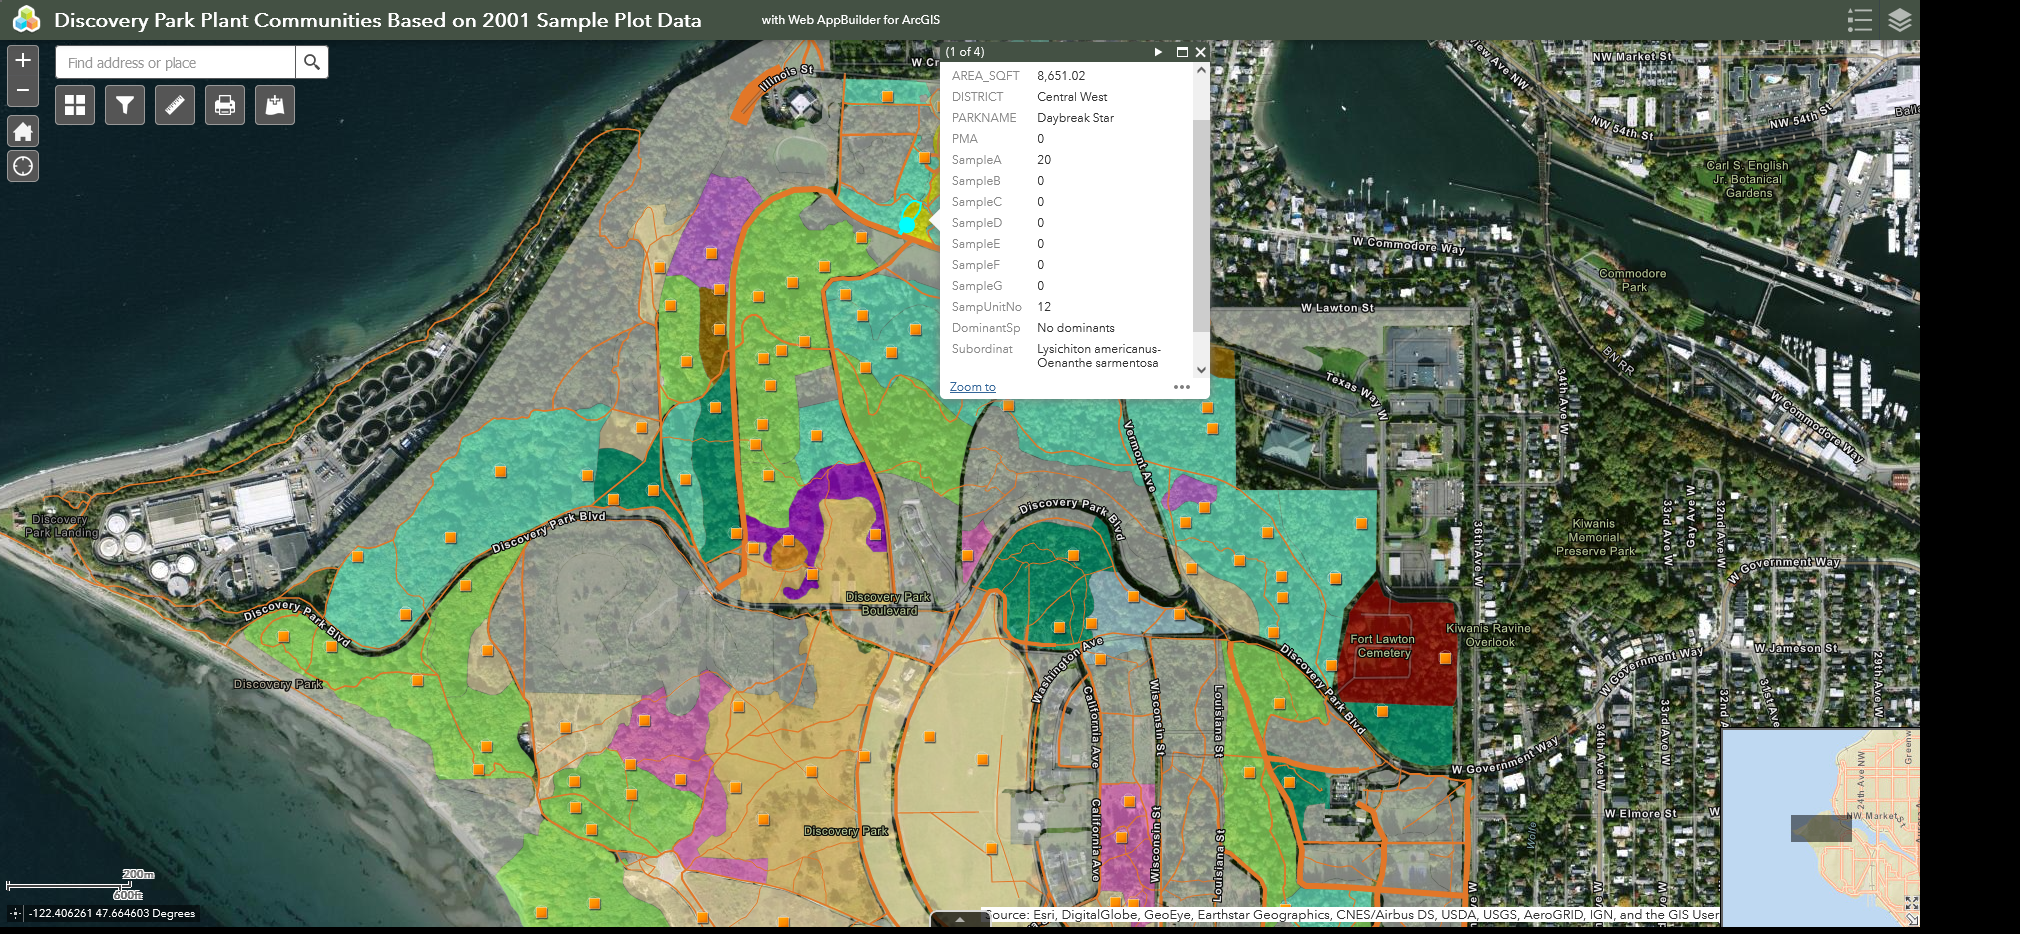 |
Discovery Park Plant Community Data and Web Map Application
The exported report from an existing Microsoft Access Database is provided below as a placeholder to provide an example of how data entered and caculated using the Vegetation Index Calculator might someday be displayed once created and linked to a relational database management system.
Note: You will notice the outcomes for the Sample 20 moisture index and weed index in the report below are different than those calculated using the Vegetation Index Calculator (see image insert above). There are two main reasons for this: 1. The percent covers used in the Discovery Park field sampling and then entered into the Microsoft Access Database were not Daubenmire cover class mid-points, but rather estimates of absolute percent cover and 2. The SQL query I developed to calculate the moisture index and weed index metrics of the vegetation data collected in Discovery Park did not differentiate by vegetation layer and then calculate the averages at the sample level (averages were calculated at the site level) but instead aggregated all the species in each sample to make the calculations. It is not my point here to defend one method over another, each has pros and cons, but rather to emphasize that when working with sites where you want to compare monitoring outcomes, it is important to select a commonly agreed upon protocol and then to apply it consistently during each respective field sampling and subsequent data management and reporting effort.