 |
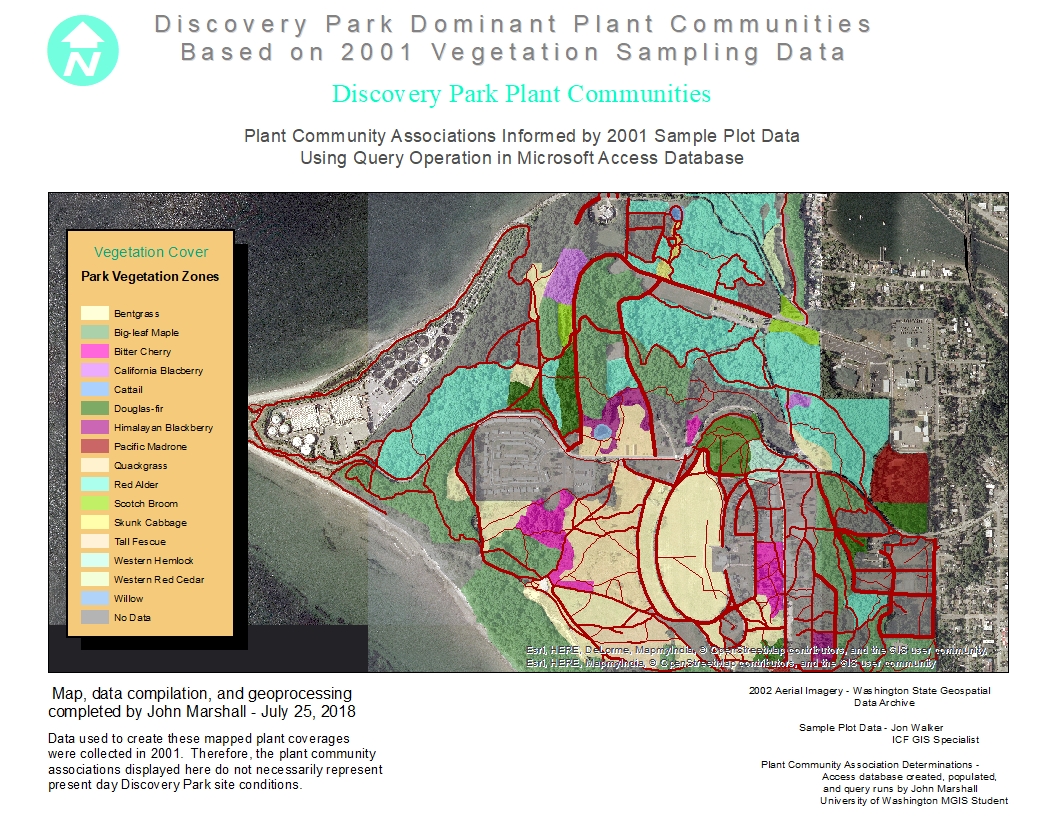
The 2001 vegetation sample plots were grouped by stratified plant cover based on
2002 aerial photo interpretation. If any species in a sample plot inside a
stratified sample unit polygon was returned in a query of >= 50% areal cover, it
was assigned a status of a dominant species in that sample unit polygon. If any
species in a sample inside a stratified sample unit polygon was returned
in a query of >= 20% And <50% areal cover, it was assigned the status of a
subordinate species in that sample unit polygon. However, a simpler more
generalized field was used to display plant communities in this map. The criteria
were the highest percent cover by dominant species present with ties going to the
superior structural type (e.g.,trees over shrubs and shrubs over herbaceous or
emergent plants). In this category the common name was used instead of the scien-
tific name. |